AI automations your operators trust and your CFO can measure.
OpsGraph finds the work worth automating, runs governed agents across CRM, support and billing over MCP, pauses risky actions for a human, and proves what each automation is worth — with evaluations and ROI you can defend in a board meeting.
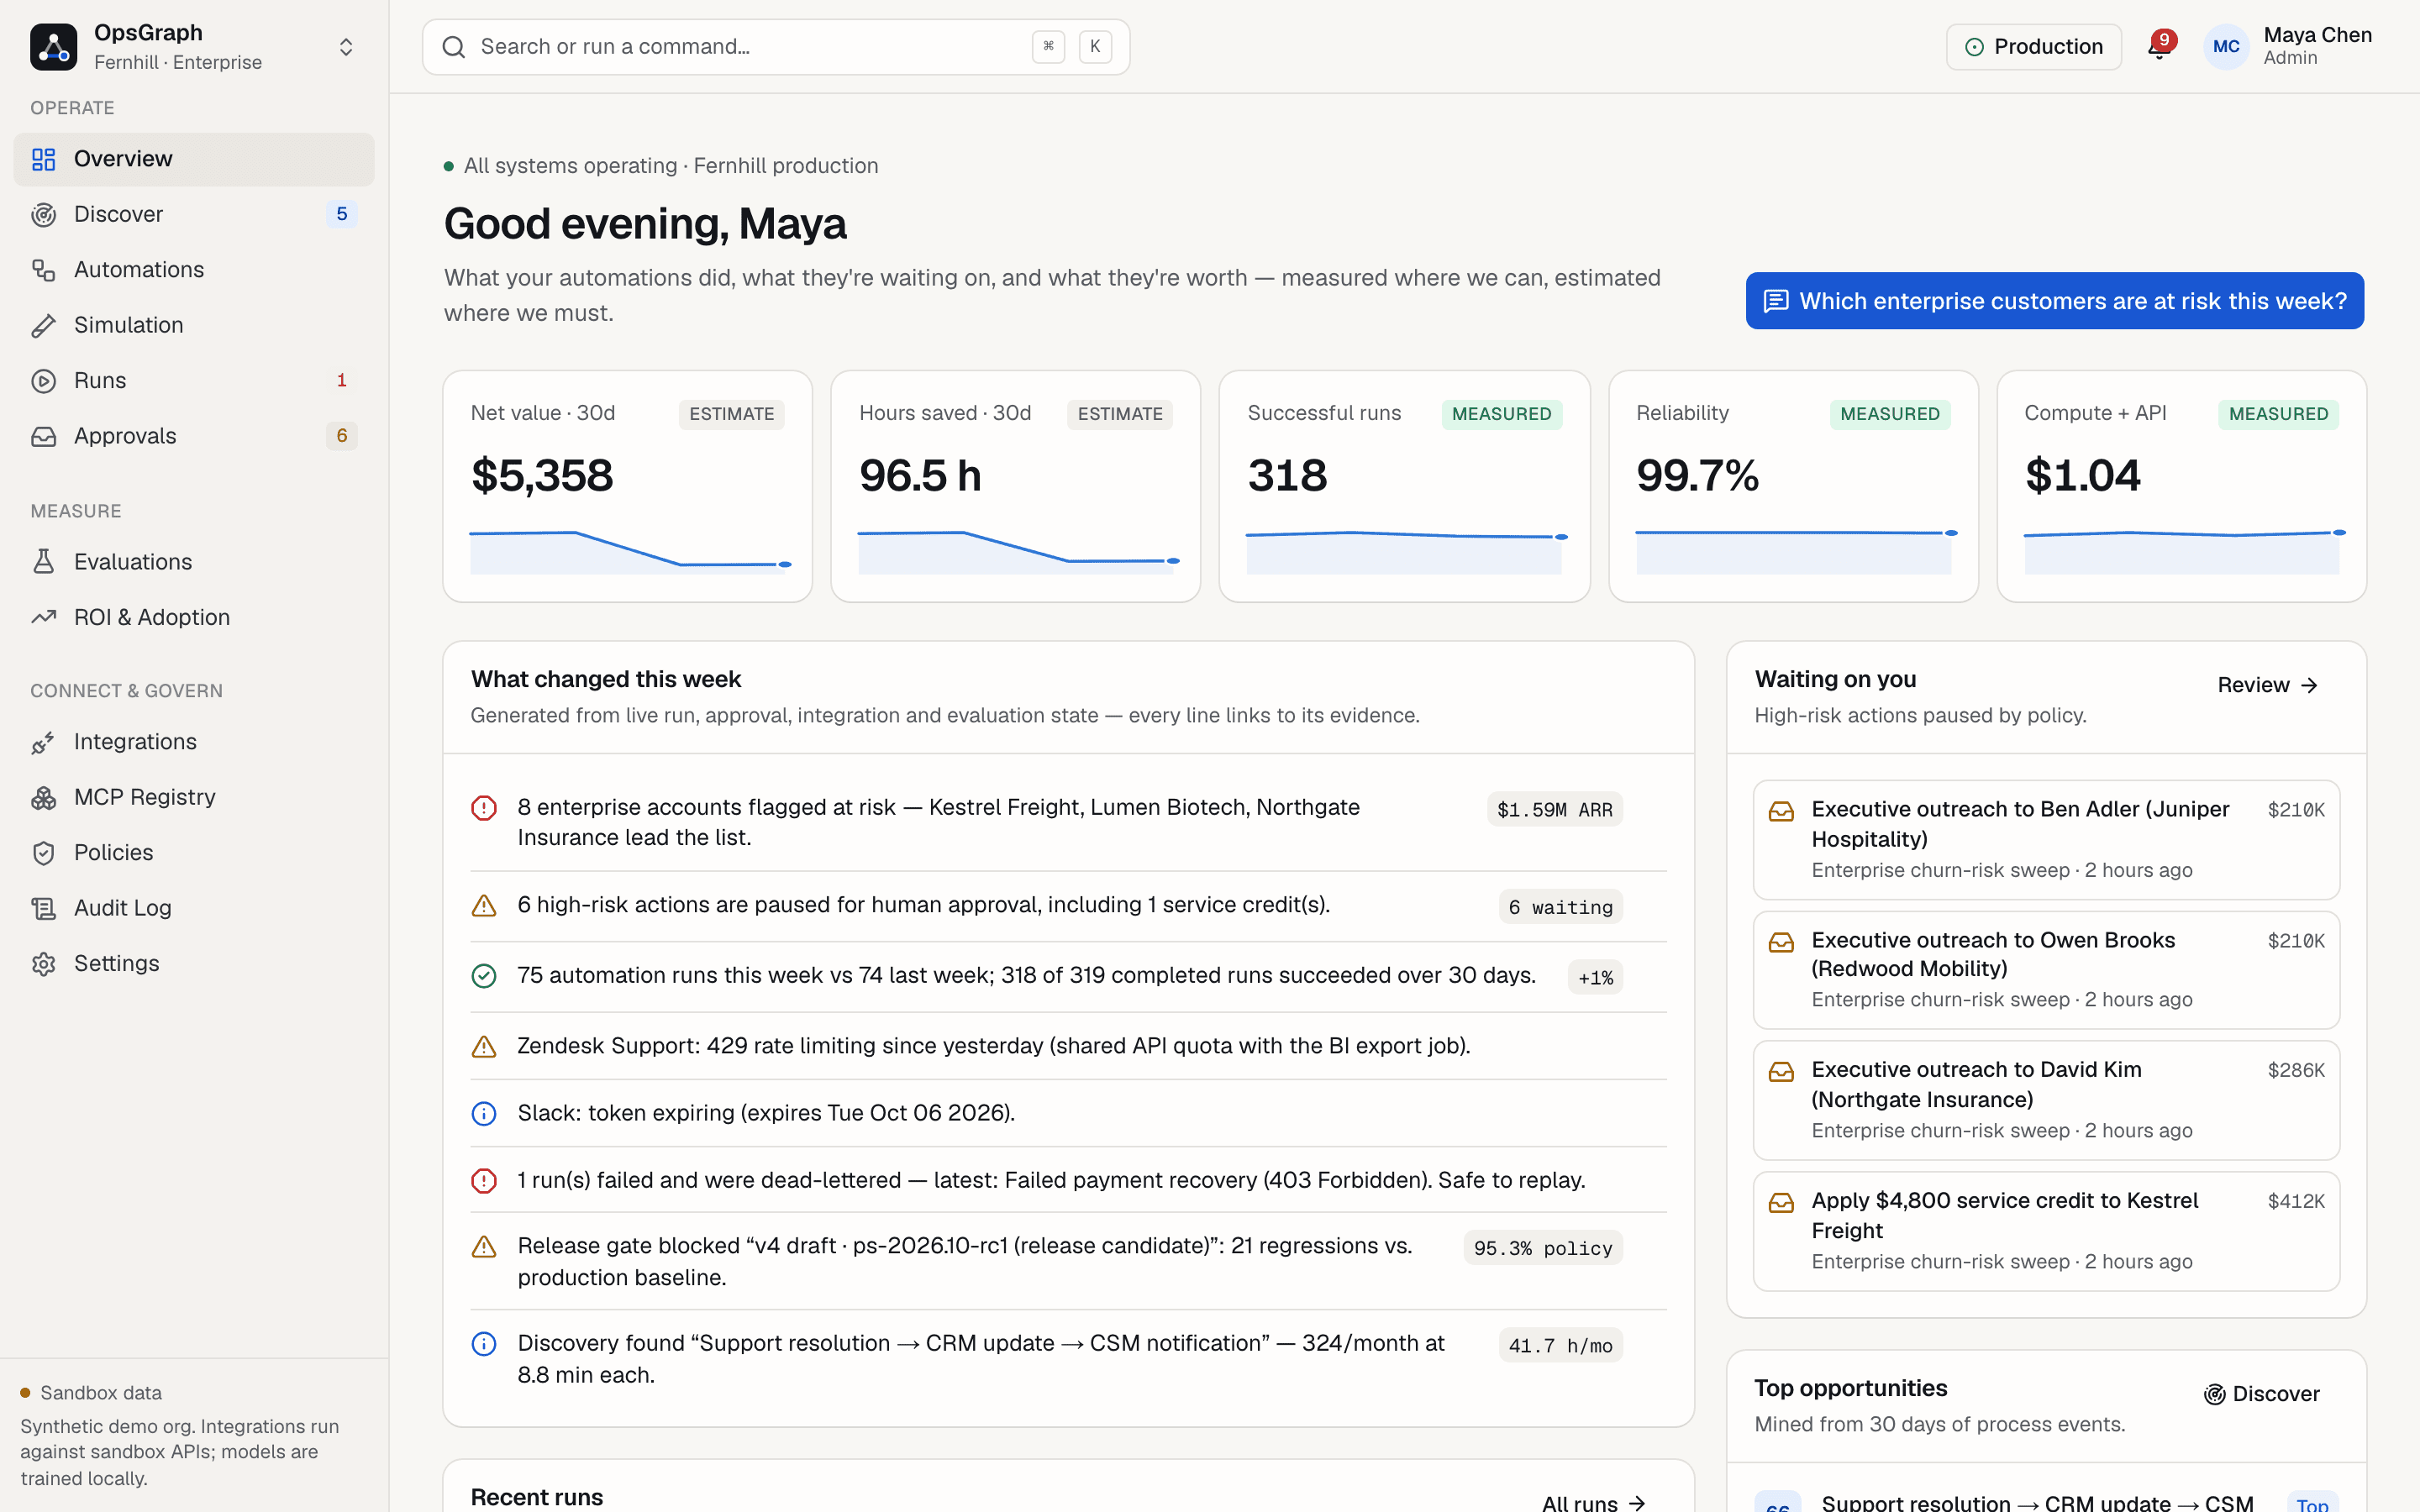
- governed runs in the last 30 days
- 320
- actions auto-executed / held for a human
- 531 / 20
- evaluation scenarios gate every release
- 260
- held-out AUC — churn model trained from scratch
- 0.842
One loop, end to end
Discover → build → simulate → approve → execute → evaluate → prove ROI.
Most agent demos stop at “the model called a tool.” OpsGraph is the operating layer around it: what to automate, how it’s allowed to act, whether it works, and what it’s worth.
Discover what’s worth automating
Variant-based process mining over 7,105 events ranks opportunities by frequency, effort, error rate and risk — with every factor visible and adjustable.
Build graphs, not prompts
A typed workflow canvas with policy and approval gates built in. Every version is schema-checked, simulated against fixtures and evaluated before it ships.
Govern every action
A server-side policy engine decides allow, notify, approve or deny. The model proposes; it never decides. High-risk writes wait on a signed, payload-bound approval token.
Survive real systems
Retries by error class, idempotency keys, durable checkpoints, dead-letter replay and circuit breakers — exercised by 30 chaos scenarios on every evaluation.
Measure quality before release
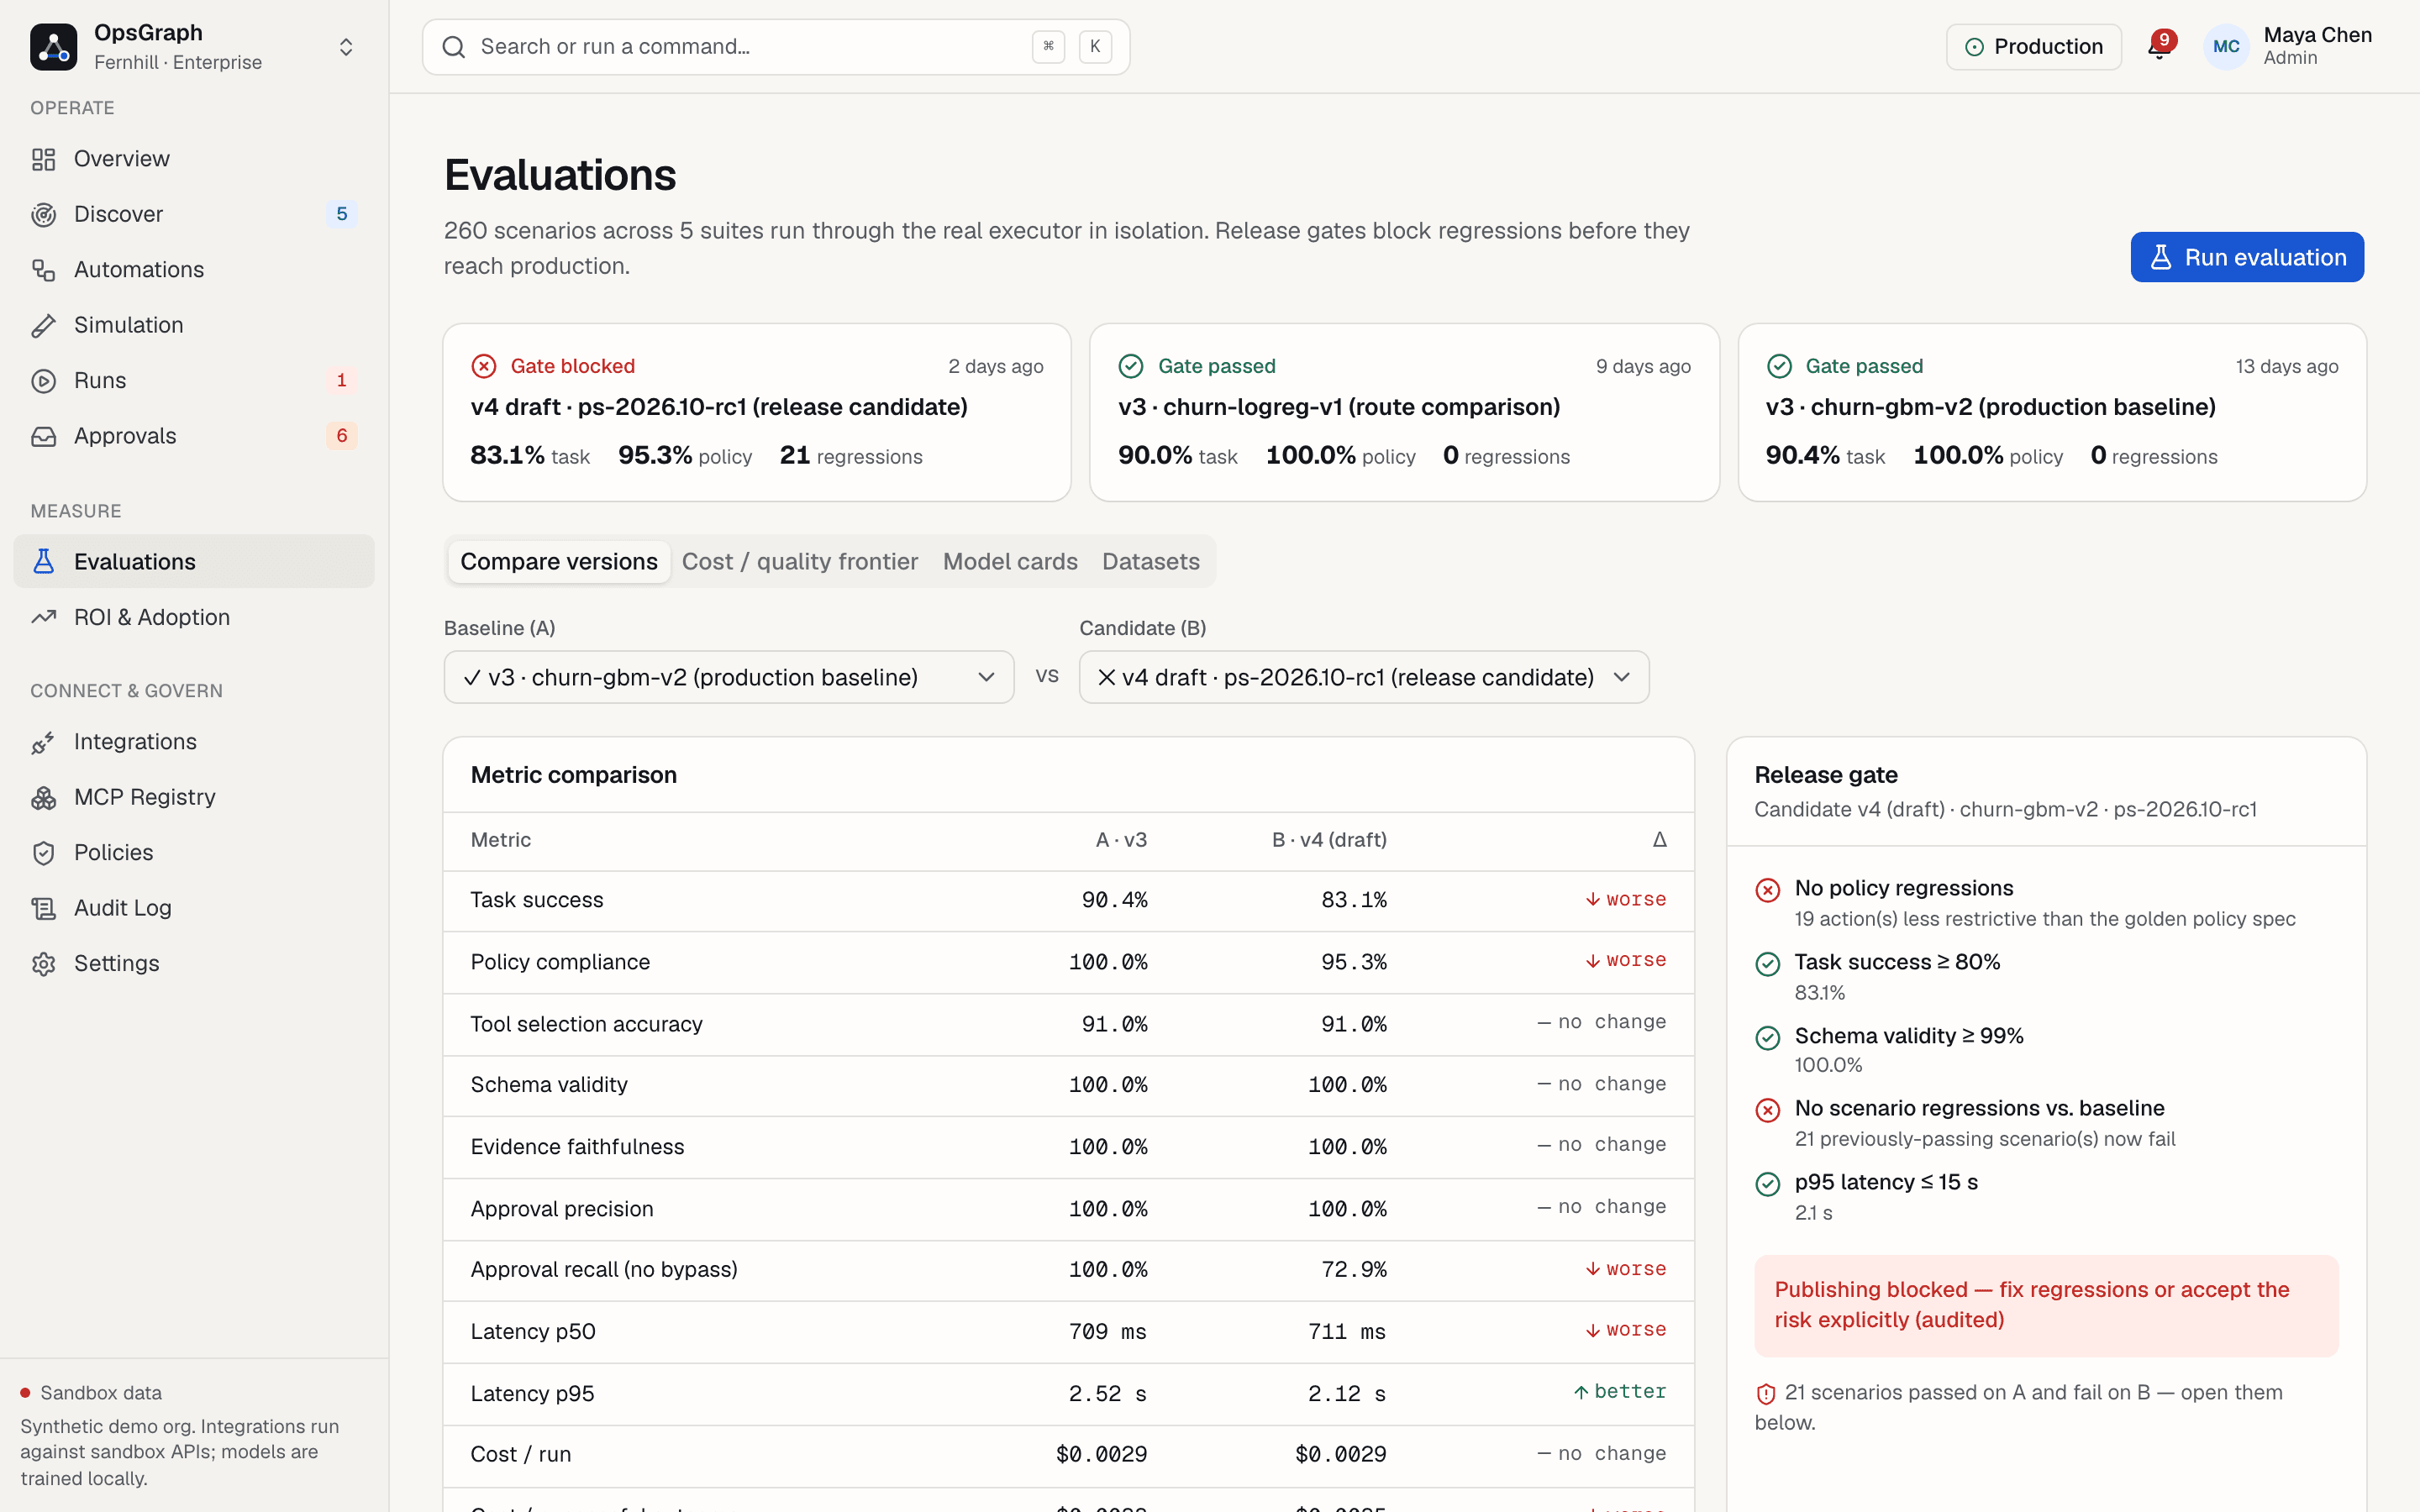
260 scenarios grade task success, tool accuracy, policy compliance and evidence faithfulness. Regressions block publishing.
Prove the value
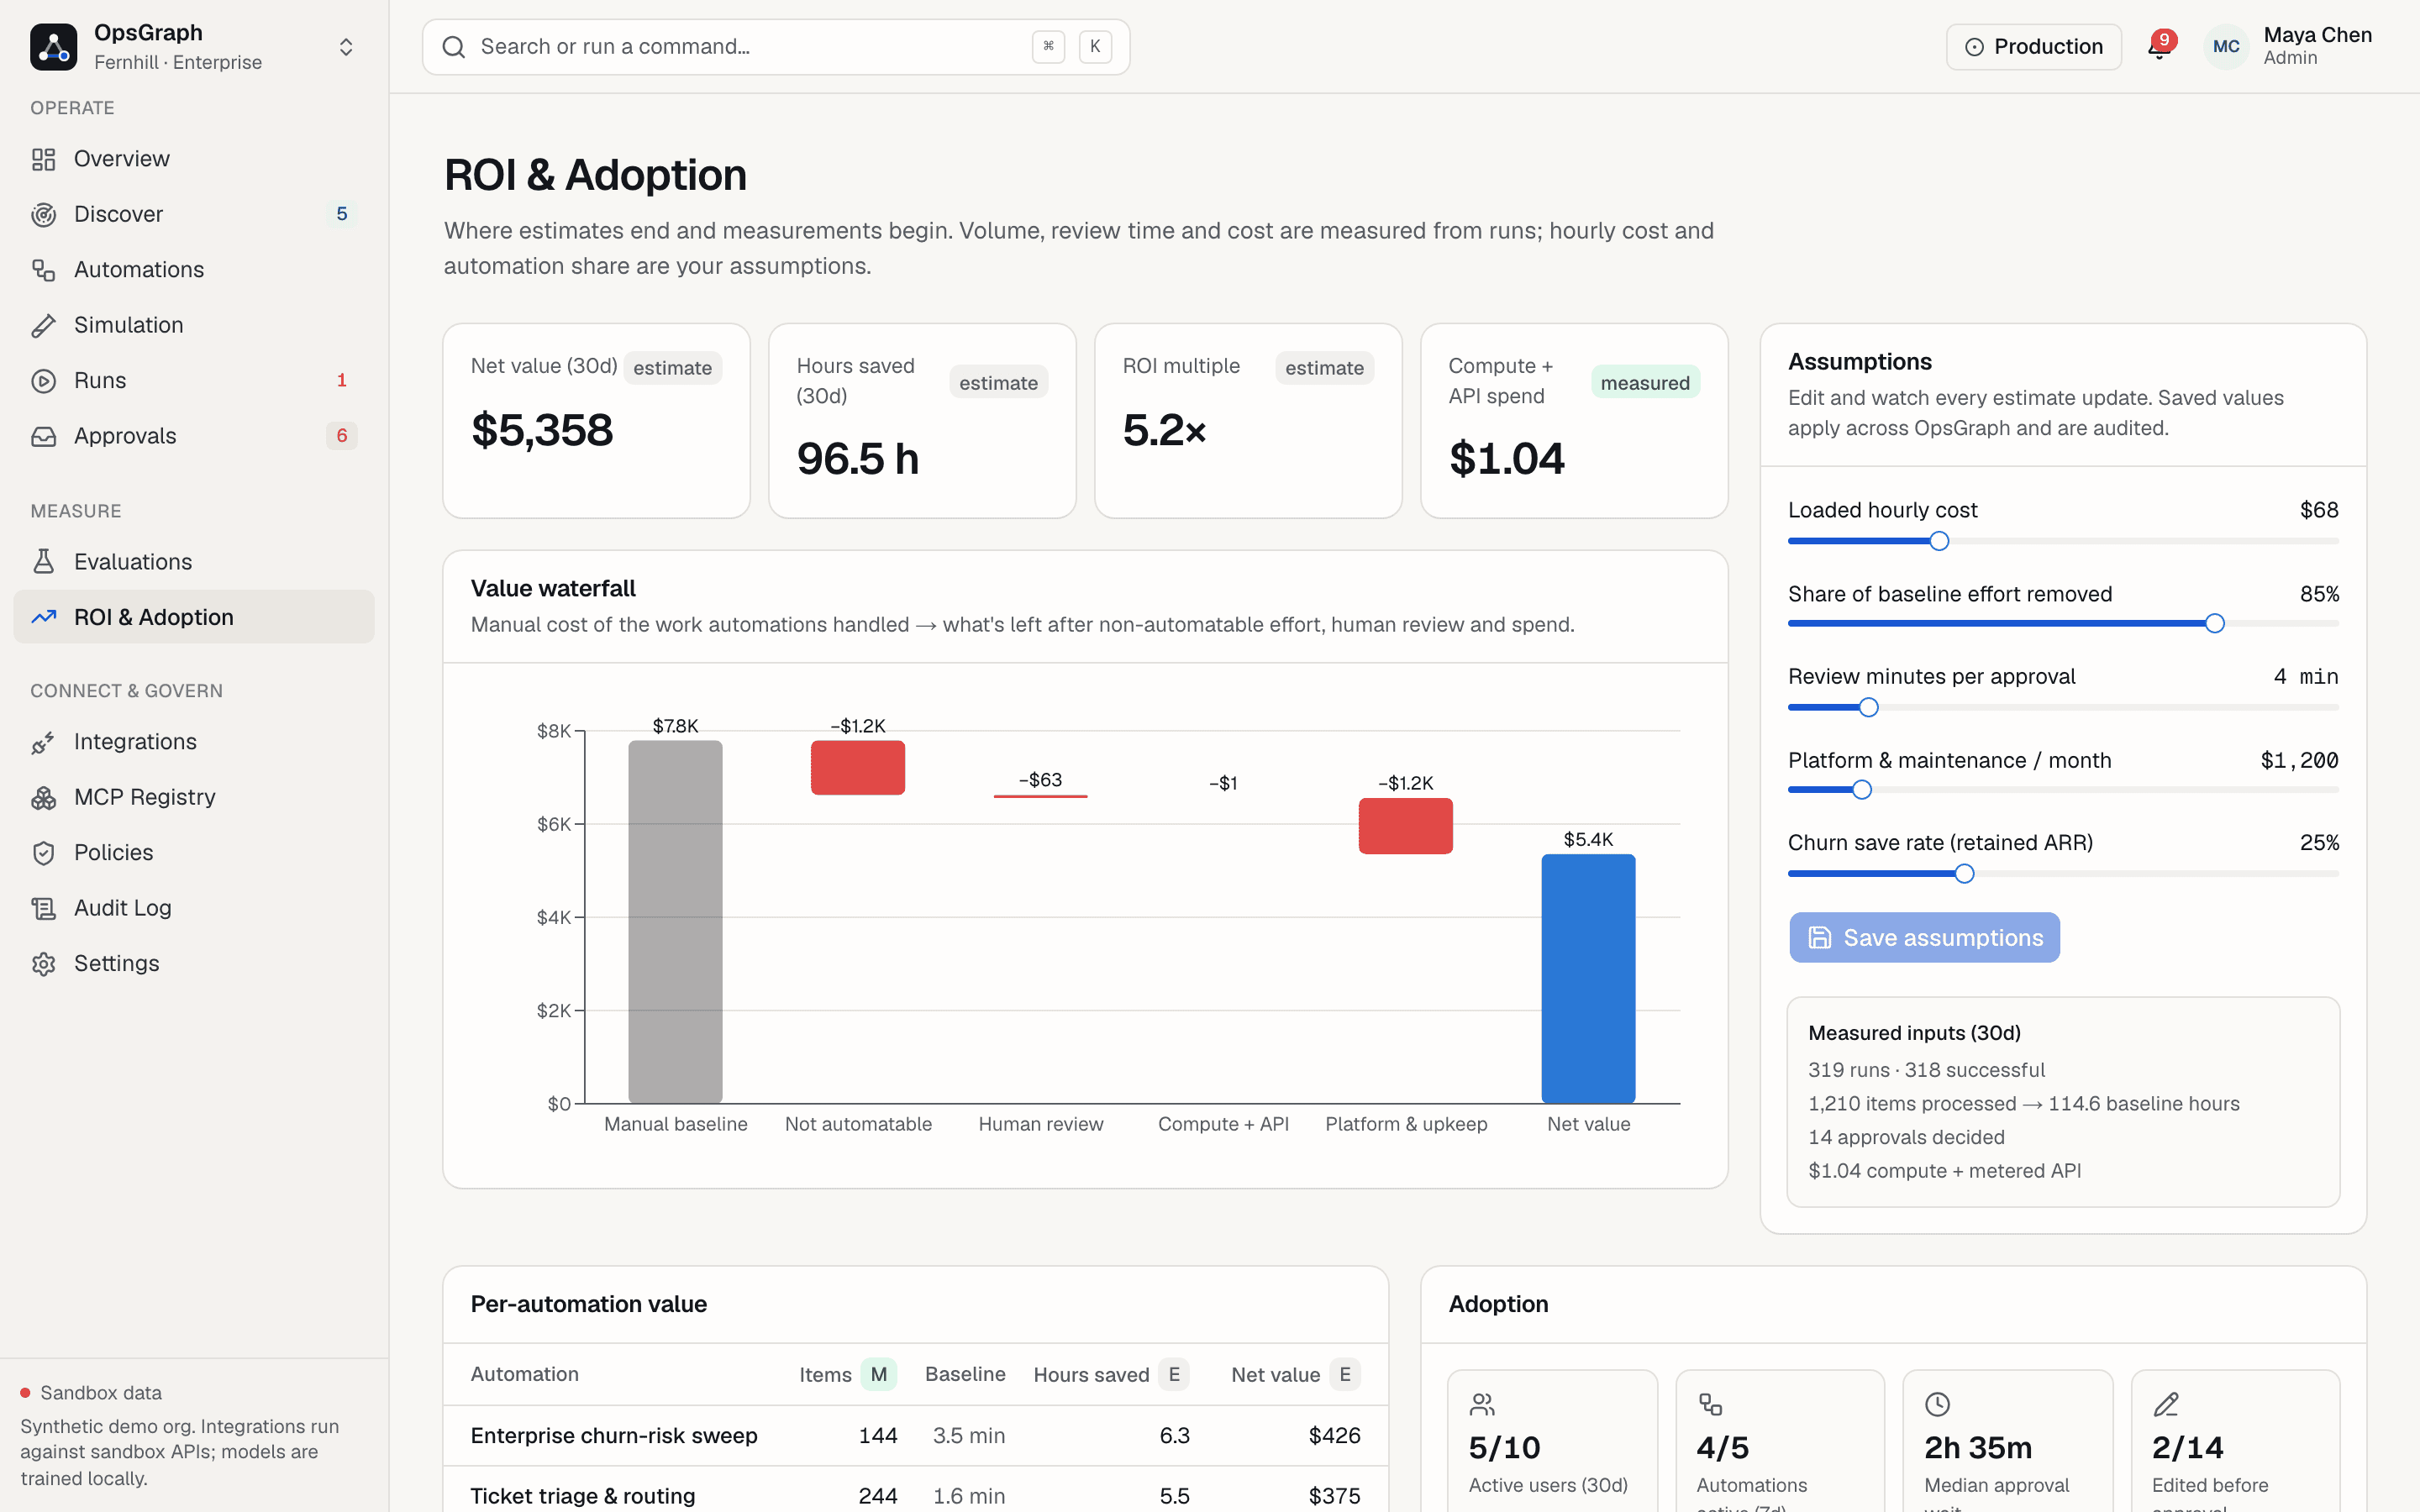
Measured volume, review time and cost on one side; editable assumptions on the other. Never confuse an estimate with a measurement.
The flagship flow
“Which enterprise customers are at risk this week, why, and what should we do?”
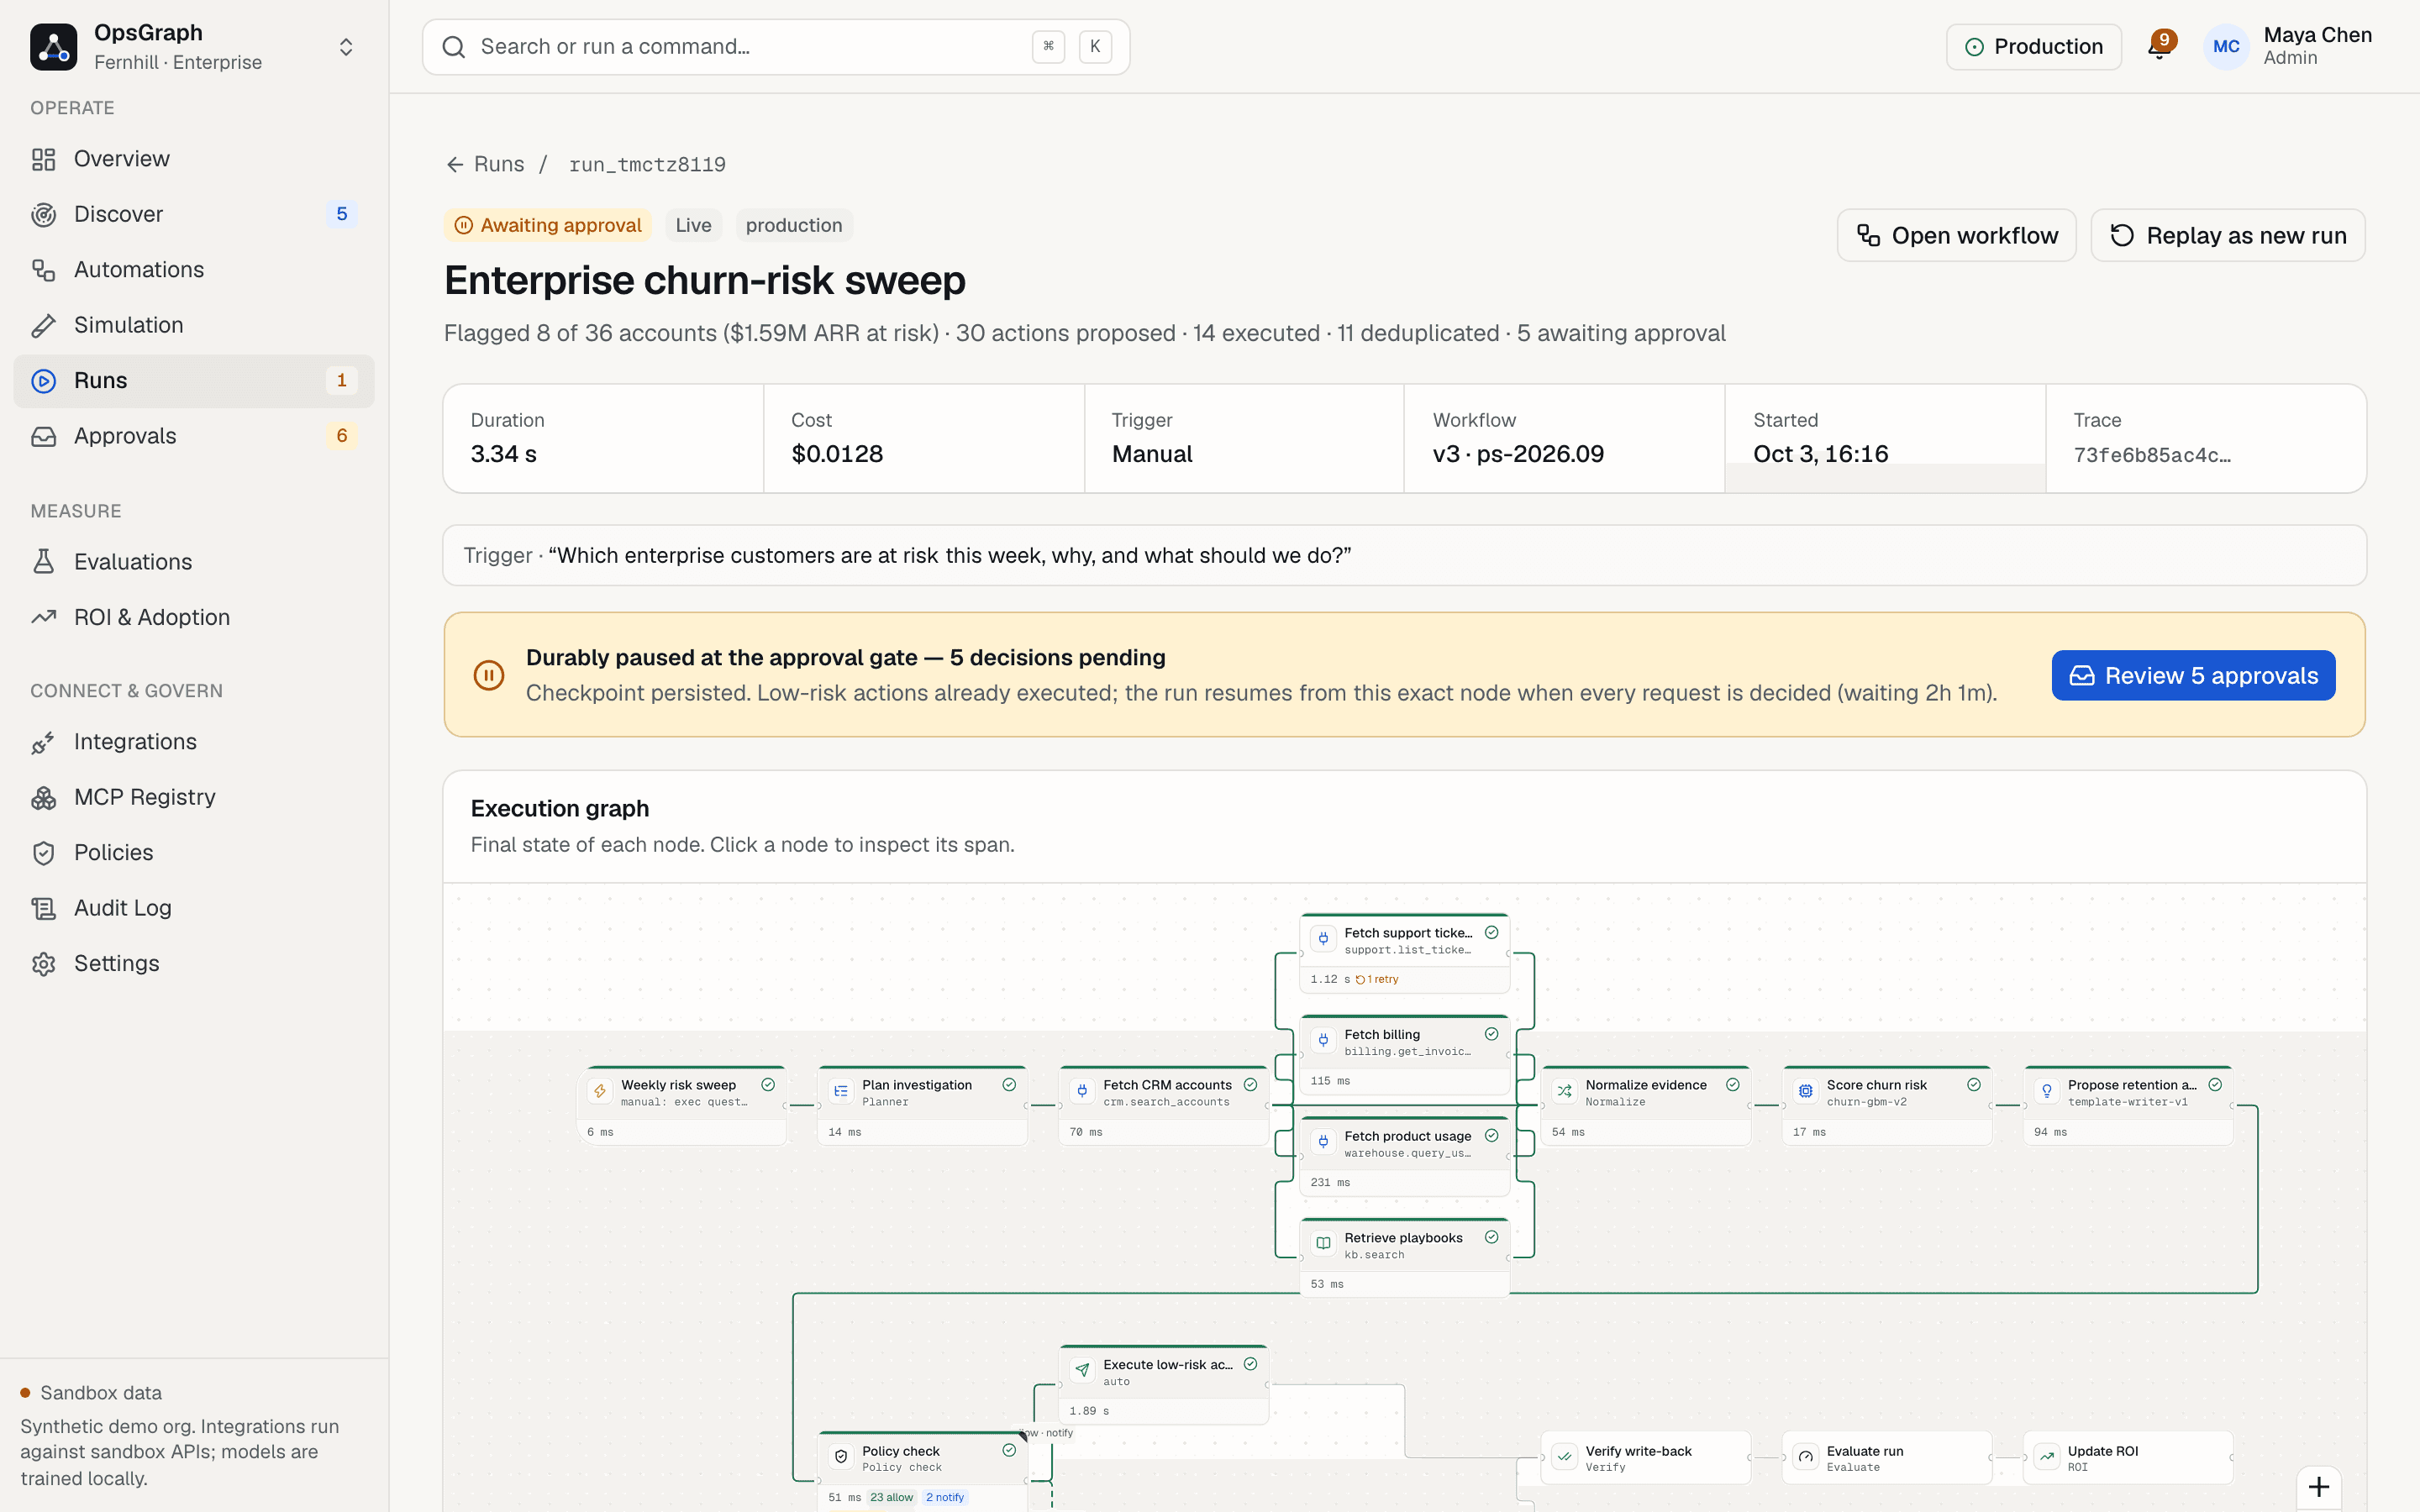
- Fetches CRM, support, billing and usage in parallel through MCP tools
- Scores every account with a gradient-boosted model trained on 7,043 labelled customers — and shows each feature’s contribution
- Proposes typed actions; the policy engine auto-runs CRM updates and pauses the $4,800 credit and executive emails
- Resumes from a durable checkpoint the moment a human approves — then verifies every write
Human in the loop, for real
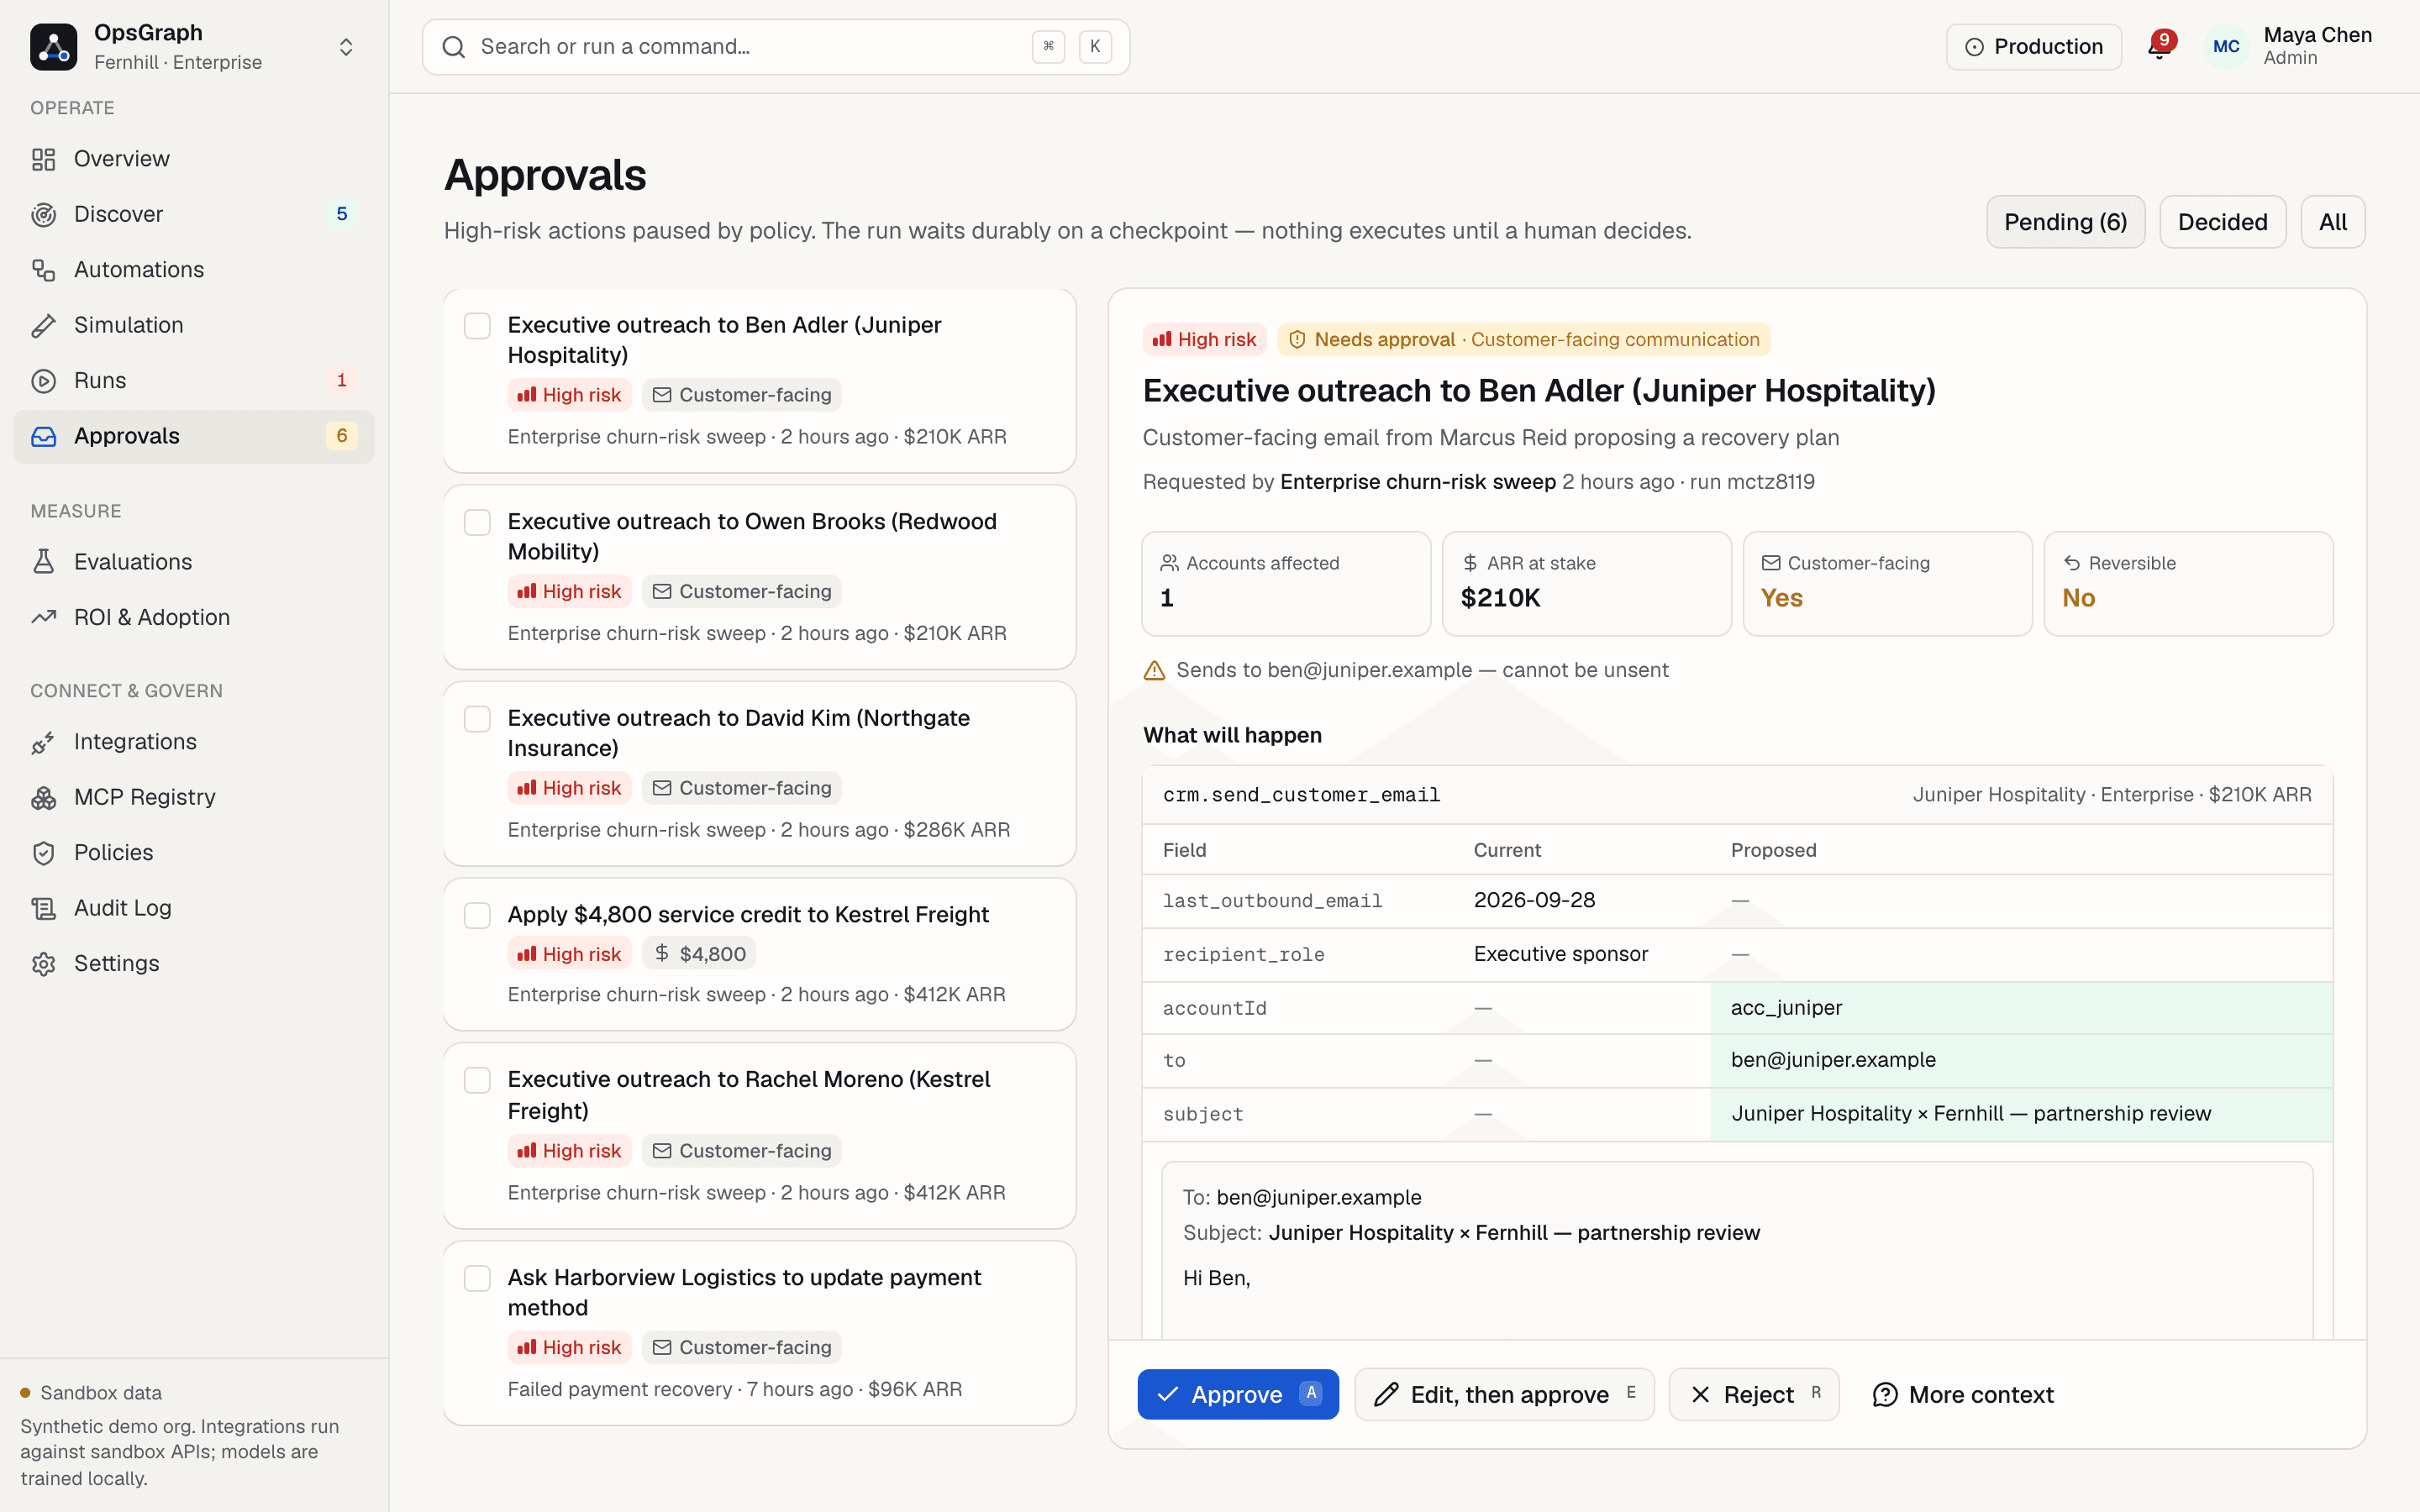
The approver sees exactly what will happen before clicking Approve.
Plain-language action, the exact record, a payload diff, the evidence, the policy that triggered review and the blast radius. Edit-then-approve re-runs the policy engine and re-binds the token.
Measured, not assumed
The release gate caught a policy regression before it shipped.
“v4 draft · ps-2026.10-rc1 (release candidate)” loosened the credit threshold to shrink the approval queue. 19 previously-passing scenarios failed and policy compliance fell to 95.3% — so it never reached production.
No hosted AI APIs: the churn models (gradient boosting + logistic regression) and the ticket router (Naive Bayes) are trained from scratch on public datasets and run inside the deployment.
MCP-native
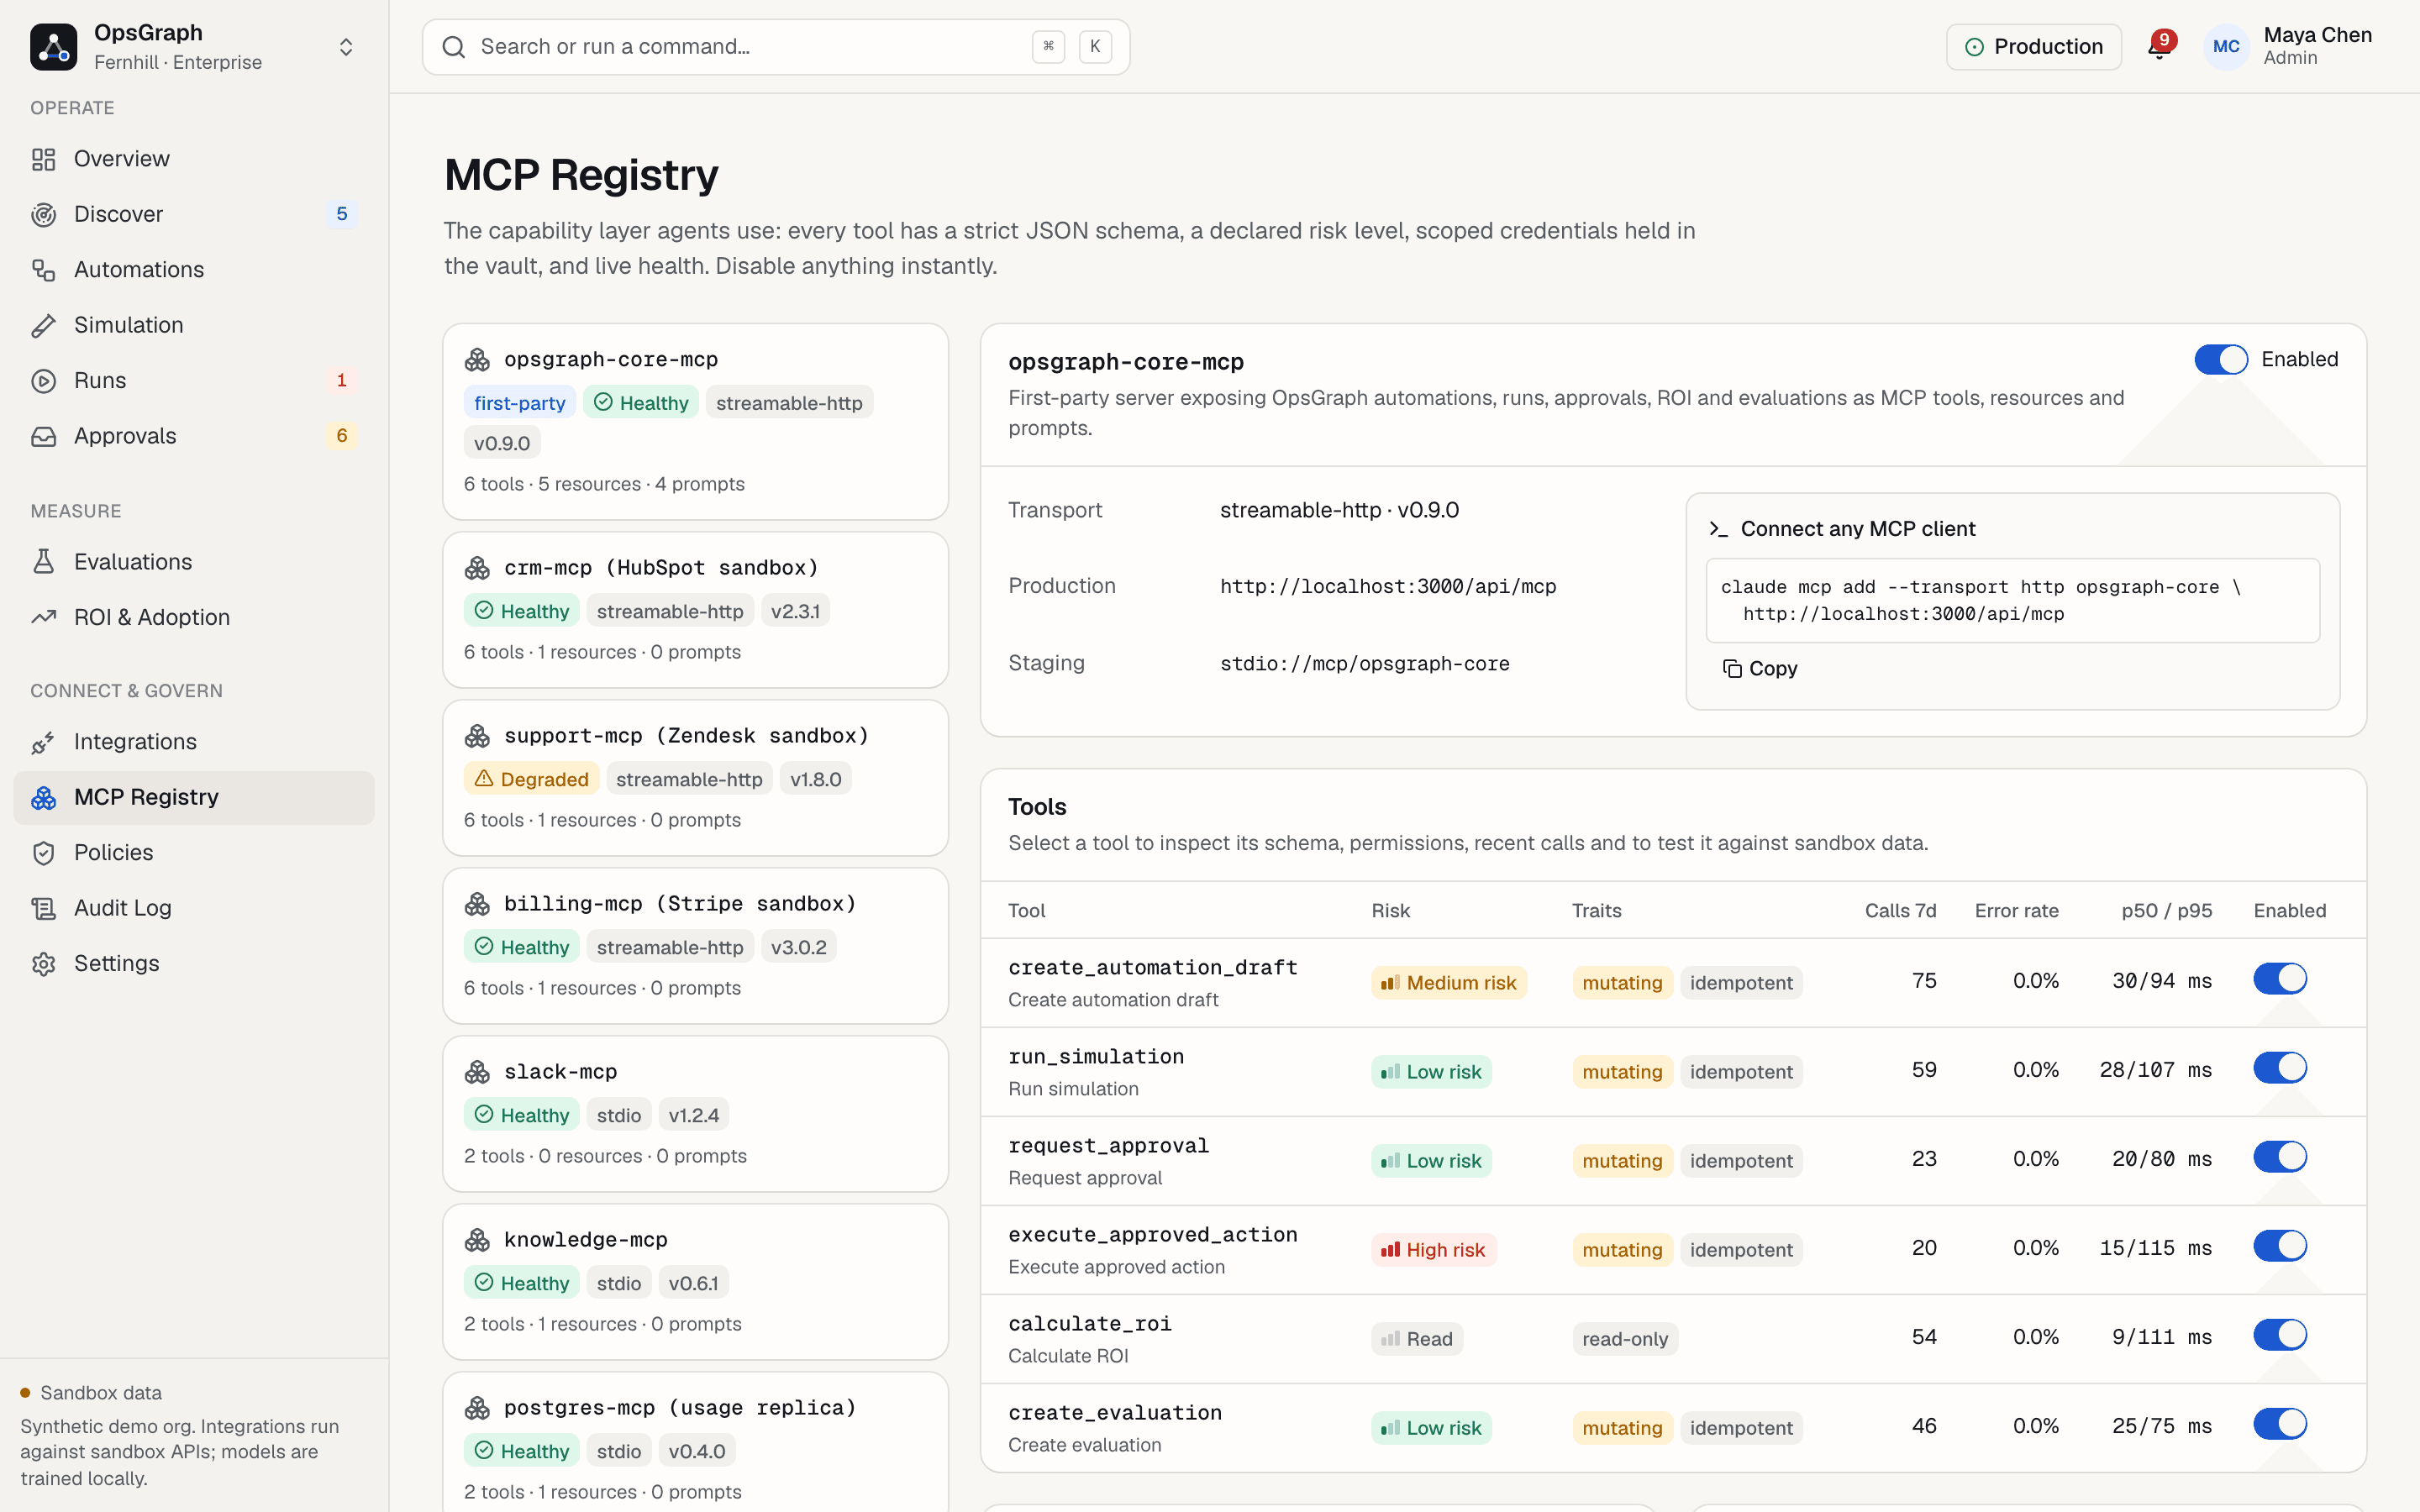
30 tools, one governed capability layer.
Strict JSON schemas, declared risk levels, scoped credentials in the vault and live p50/p95 for every tool. OpsGraph ships its own first-party server, so any MCP client can drive automations through the same policy path.
$ claude mcp add --transport http opsgraph-core \
    http://localhost:3000/api/mcp
tools · resources · prompts — create_automation_draft, run_simulation, calculate_roi…
Where estimates end and measurements begin
96 hours and $5,358 net value in 30 days — with the assumptions on screen.
Volume, review time and spend are measured from runs. Hourly cost, automation share and platform upkeep are yours to edit. Retained-revenue estimates are shown separately and never added to the total.